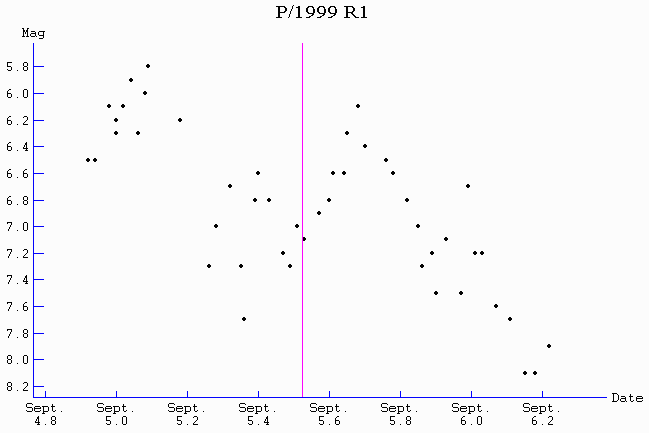
The peak on the left side is summarized as "near mag 6 on 1999 Sep 5.1" on IAUC 8872. Also visible is the second peak at Sep 5.7 (after perihelion).
Light Curves of the
"Kracht2 group" comets
(all images were made with
"Comet for Windows")
P/1999 R1 = 2003 R5 = 2007 R5
IAUC 8872 (2007 Sep 18) lists peak brightnesses of P/1999 R1 =
2003 R5 = 2007 R5 as
1999 Sep 05.1 mag 6
2003 Sep 08.4 mag 6
2007 Sep 11.0 mag 5.5
"a few hours after perihelion each time" (measured by
M. Knight).
MPEC 2007-S16 (2007 Sep 18) has perihelion times for the
linked orbits as:
1999 Sep 05.52
2003 Sep 08.82
2007 Sep 11.32
The peak brightnesses of IAUC 8872 are 0.42/0.42/0.32 days
(about nine hours) before the perihelion times.
An incomplete correction ("the brightness peak in 2007
actually occured shortly before perihelion") was issued on
IAUC 8877 (2007 Oct 09).
M. Knight has kindly provided all his measurements of the
"Kracht2 group" comets to me before publication.
They include error estimates of the magnitudes, approximate phase
angles assuming SOHO to be at L1 and the vignetting factors.
For this page, I have omitted all magnitudes with errors of more
than mag 0.5 and vignetting factors of more than 2.51.
The phase angles for his peak brightnesses are
1999 Sep 05.1 152 deg in C2
2003 Sep 08.4 155 deg in C2
2007 Sep 11.0 152 deg in C2 and C3
indicating strong brightness enhancements from forward
scattering.
Using the parameters given in M. Knight's thesis for the
Kreutz comets the corrections for these phase angles are mag
1.5/1.8/1.5 in C2 and mag 2.3 in C3
Without forward scattering the "peaks" would have been
about two magnitudes fainter, that is (7.5/7.8/7.0-7.8) about mag
7-8.
M. Knight's measurements show a second peak about four hours after
perhelion for P/1999 R1 and 2003 R5 and eight hours after
perihelion for 2007 R5:
1999 Sep 05.68 mag 6.2
2003 Sep 08.98 mag 6.5
2007 Sep 11.64 mag 5.5
The corresponding phase angles are 95/97/84 degree, with very
small (< 0.1 mag) corrections.
Graph of the measured (uncorrected for phase angle) magnitudes
of P/1999 R1:

The peak on the left side is summarized as "near mag 6 on
1999 Sep 5.1" on IAUC 8872. Also visible is the second peak
at Sep 5.7 (after perihelion).
After correcting for phase angles/scattering the graph looks
like this:
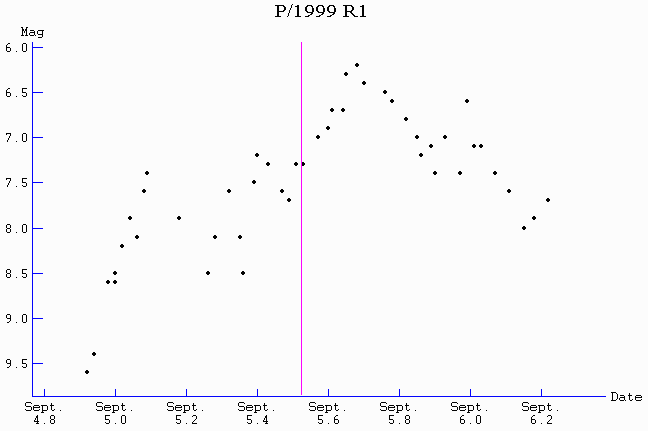
The first peak is much subdued and the second peak (1999 Sep
05.68, mag 6.2) is prominent.
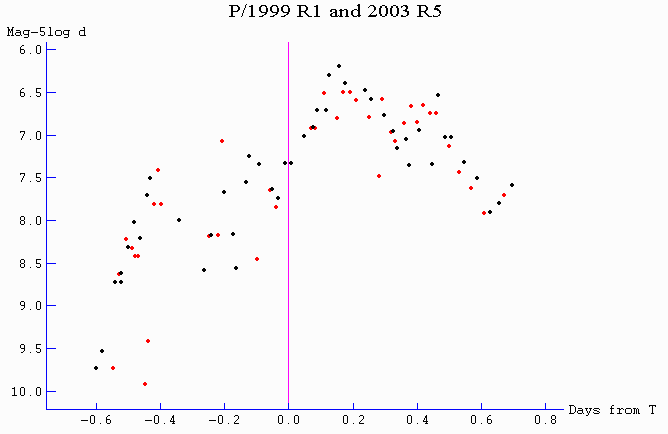
The phase corrected light curve of P/2003 R5 (red dots) looks
very similar:
The phase corrected light curve of P/2007 R5 (red dots) looks
different from the other two after perihelion:
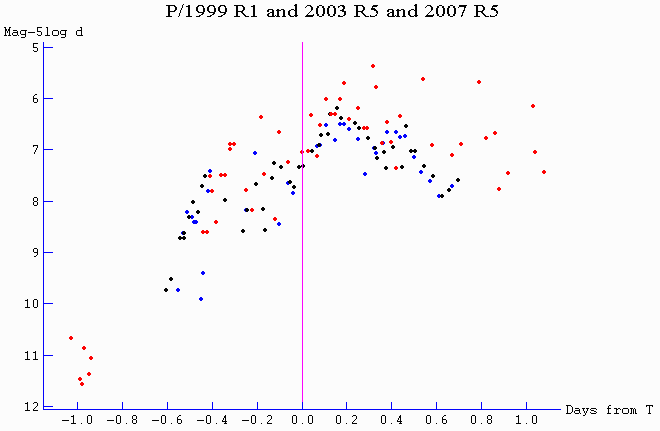
P/1999 R1 (black dots), P/2003 R5 (blue dots)
The comet looks brighter after perihelion in 2007 than in 1999
and 2003 with much more scatter in magnitudes.
other magnitude measurements:
IAUC 7251 (1999 Sep 09) lists
magnitudes for P/1999 R1 measured by D.A. Biesecker using the
Hipparcus Input Catalogue.
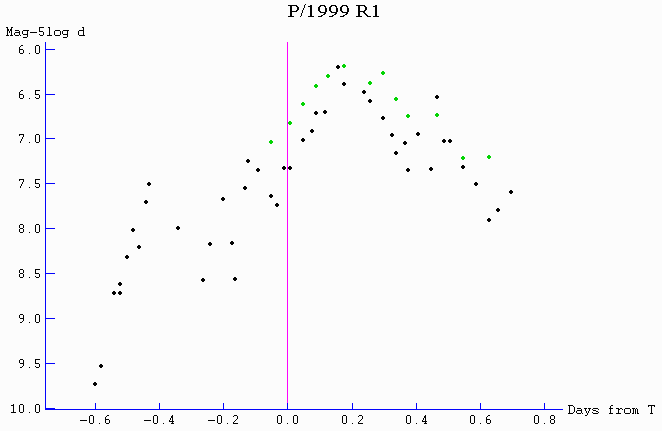
His measurements (green dots) are here compared with Knight's
measurements (black dots).
Both data sets are here corrected for phase angle. Biesecker's
peak agrees very well with the peak from
Knight's data. Biesecker's measurements before and after the peak
are generally several tenth of
magnitude brighter than those from Knight.
The comets-ml list has my measurements of P/2007 R5 with
Astrometica using the USNO-B 1.0 catalogue in message
#12702.
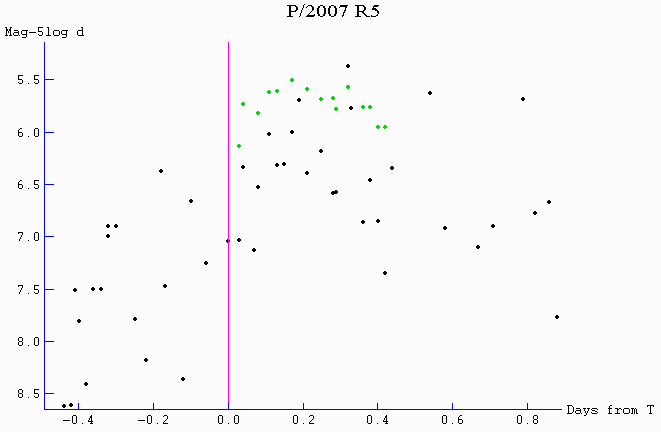
My measurements (green dots) are here compared with Knight's
measurements (black dots).
Both data sets are here corrected for phase angle.
My measurements are all brighter than those
measured by Knight, the position of the peak looks earlier (at
T+0.17d), quite similar to the peaks
of P/1999 R1 and P/2003 R5.
C/2002 R5 = C/2008 L6 and L7 (all magnitudes corrected for phase angle)
Matthew Knight has also measured C/2002 R5 (=2008 L6/L7):
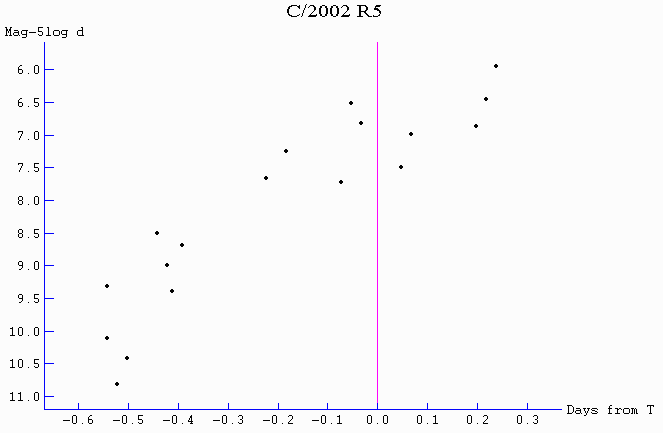
Again, there is a steep rise of magnitudes before perihelion and
a (possible) peak several hours after perihelion.
Actually these magnitudes are the combined magnitudes of C/2008
L6 and L7 at their perihelion in 2002.
Their separation distance did not exceed 2" in 2002 (IAUC
8983).
After reading M.
Knight's thesis, I have improved my brightness measurements
of SOHO comets in two ways:
First, I correct now the images for different exposure times
(taken from the FITS headers) before I compute the
(minimum) background images. Second, I correct now the images
with the vignetting factors. But I still use all
C2 ore C3 images of the comet to derive the (minimum) background
image.
The result for C/2002 R5 looks good:
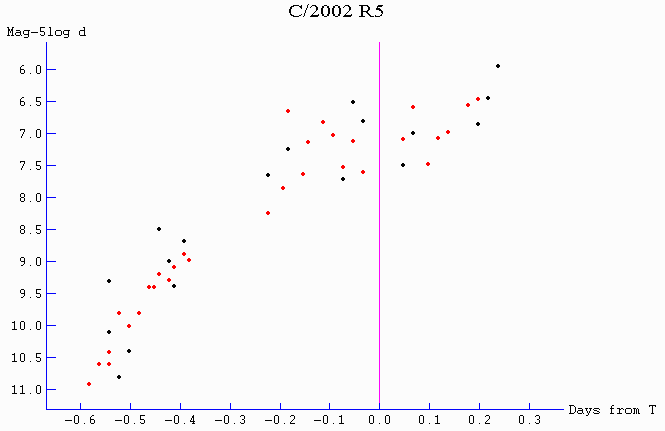
My measurements (red dots) compare well with those of M. Knight
(black dots). Both data sets show much scatter
around perihelion (in C3 close the sun). My latest two data
points are not shown as they are coincident with
M. Knight's data. The measurements suggest a peak several hours
after perihelion.
C/2002 R5 has returned as 2008 L6 and L7 (MPEC 2008-O23, IAUC
8983):
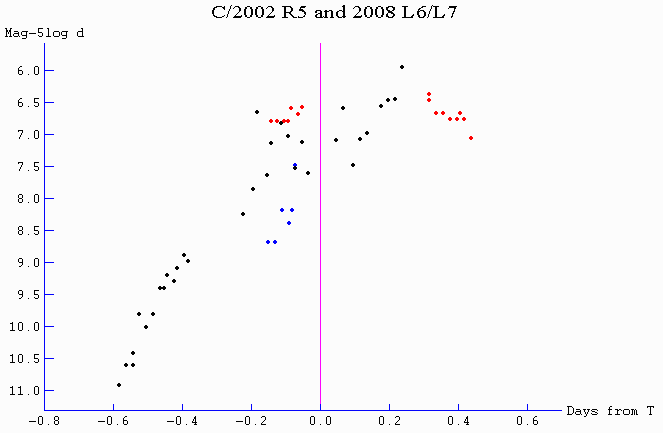
My measurements of C/2002 R5 (black dots), 2008 L6 (red) and 2008
L7 (blue).
The peak of brightness several hours after perihelion seems to be
confirmed.
Backward integration of the orbit of C/2002 R5 = 2008 L6
results in a perihelion date of 1996 Nov 25.335
(08:02 UTC) with q = 0.0478, e = 0.98515, peri = 45.50, node =
13.64, incl = 14.23 deg. The comet crossed
the LASCO C2 field from T-5.5h to T+6.5h, that is from 1996 Nov
25 02:30 to 14:30 UTC.
It should have been well visible when it left the C2 field after
perihelion with a magnitude of about mag 6.5 (corrected
for phase angle, uncorrected/apparent magnitude is about 5.3),
but I have found nothing in those images!
The comet must have been inactive at that time. It became
visible after it split ("most probably between two to ten
weeks
before the 2002 perihelion" IAUC 8983). It seems possible
that there are more sunskirting comets like this.
Rainer Kracht, 2009 January 28